Chapter 7 A/B Testing: Beyond Randomized Experiments
In the last few chapters we focused on essential ideas in causal inference to identify causal effect from randomized or observational data. Traditionally, causal inference is a secret weapon wielded mainly by academic researchers in fields like social science, economics, psychology, biostatistics and pharmaceutical sciences. In these applications, a dataset with thousands of subjects and more than 10 attributes per subject is considered fairly large. From the beginning of this century, with the expanding of a connected world through world-wide web and mobile devices, cheaper data connection, storage, and computation, and the resurgence of artificial intelligence, “Big Data” has been redefined by the online industry. In 2018, a Forbes article15 estimated the size of data created each day is in the order of Exabytes (one Exabytes is 1 million Terabytes) and it is growing exponentially fast with the growth of the Internet of Things (IoT). In this transformation to the big data era, causal inference also evolved and adapted to the online industry and became an important component in distilling data into knowledge.
Online randomization experiments, often called A/B tests in the online industry (sometimes under different names such as split testing and bucket testing), are the reincarnation of the classic randomized experiments in the new era. The idea of business-hypothesis-driven experimentation, iteratively and continuously deploy and evolve a product is a defining characteristic of product development for online companies. Ries (2011) included A/B tests (split testing in the book) in the definition of a lean startup — a term the author coined as a new methodology for developing businesses and products. Listen to the customers, not the HiPPO (Highest Paid Person’s Opinion) (Kohavi et al. 2009)!
The central idea of Ceteris paribus, “all other things being equal,” remains the key intuition that is obvious to anyone. One of the main reasons of the rapid adaptation of A/B testing is its simplicity, as it does not require people to understand deep statistics and probability theory to grasp the idea and be convinced that the change observed must be a causal effect. However, A/B testing is not just a direct adaptation of classic randomized experiments to a new type of business and data. It has its own special aspects, unique characteristics and challenges.
7.1 Special Aspects of A/B Tests
Scale. There are a few aspects of scale that make A/B tests different from traditional applications of randomized experiments. The sample size — the number of units that are randomized — is usually at least in the order of thousands. A typical test conducted on a large scale product such as search engine (Tang et al. 2010; Kohavi et al. 2013), social network (Bakshy, Eckles, and Bernstein 2014; Xu et al. 2015), e-commerce or web video streaming (Gomez-Uribe and Hunt 2016) can easily “recruit” millions of individual users.
Large scale does not only affect the number of samples, but also the reach and coverage of experiments. For online businesses it is not difficult to conduct experiments across different geo-markets, leading to a better representation of the user base. Experimenters can still choose to analyze each user segments individually to understand potential effect variations.
Large scale and sample size also lead to increased sensitivity. In A/B tests, experimenters are often able to detect a small change of 1%.16 In some large scale tests, a change of 0.1% can also be detected. Large sample brings many goodness (and challenges) to the analysis of A/B tests, more to come in Chapter 8. Despite the bless of large sample, A/B tests community are never satisfied with enough sample size and statistical power. Large scale means even a small change can have a big aggregated impact. A 0.1% lift in revenue for a product with a billion revenue annually is a million dollars every year which is enough to fund a small team. Kohavi et al. (2014) reported “an engineer that improves sever performance by 10msec (that’s 1/30 of the speed that our eyes blink) more than pays for their fully-loaded annual costs.”
Agility. A mature A/B test platform allows experimenters to run an experiment from days to weeks. Early stage experiments focusing on getting the general direction of a change, whether the effect is likely positive, negative or negligibly small, can often get results back in only a few days. A latter stage ship-decision experiment often takes about a week to a few weeks. An experiment running more than a month is often considered a long-running experiment and needed when novelty or learning effect is expected or the experiment has very low exposure (e.g. a feature with very low triggering rate). The agility also means the speed of start and stop of an experiment need to be fast. Many online products, especially those deployed to a modern cloud, can safely deploy a standard code change within a hour, and deploy an urgent fix or emergency shutdown of an experiment in minutes.
Another aspects of agility is continuous data ingestion and short time to analysis results. In A/B tests, data flows in continuously as users use products in real time and the observations for each subject are cumulated over time. This has several implications that could be surprising to a novice. First, sample size increases over time. But it likely will increase only sub-linearly. In fact, the most common unit of interest is user and for most online products there are always one type of recurring heavy users and another type of less engaged and somewhat casual users. All the users at the first day are “new” for the experiment, and at the second day, only users who didn’t appear at the first day are incremental. Similarly, at the k-th day, incremental users are those didn’t appear for the past k-1 days. The number of incremental “new” users will generally decrease as k increases. Second and maybe more important, the notion of the population also changes over time. When doing any statistical analysis, we model the observed data as a sample from a population and the observations follow some distribution. When data is continuously ingested, this hypothesized population also changes continuously. For instance, if we are interested in users’ visits frequency, we look at visits per user. The day one population will contains more heavy users who use the product everyday. As we run the experiment, more and more casual users will be included. So the “mixture” of users keep changing. Also, it is obvious that the distribution of users’ total number of visits is changing. For a product with many recurring users, visits per user — the average of visits — will only increase. Figure 7.1 shows the changes of sample sizes (square root), mean and standard deviation of visits per user (a visit is called a session for search engine) for an experiment on Microsoft Bing (Kohavi et al. 2012). If the sample sizes were to increase linearly, after 9 days, the square root of sample size should be tripled. The reality is it grew by about 60% so the sample size increases su-linearly. The mean and standard deviation of visits per user also increases over time.
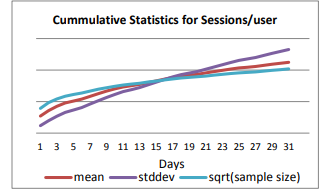
Figure 7.1: (Appeared in Kohavi et al. (2012)) Changes of square root of sample size (square root), mean and standard deviation over time for Sessions/User.
Exception of the above phenomenon exists when the unit of randomization is each visit or page-view — in this case sample size is the number of visits or page-views and by definition there is no recurring units so the sample size will be the sum of sample sizes everyday.
Rich Data. Because collecting data is cheap, and storing data is becoming cheaper everyday, online businesses can possess a very comprehensive dataset that can be used to deeply understand user behavior. On one hand this is a huge advantage. For A/B testing, it is very common to define hundreds to even thousands of different metrics each telling a different story about the subjects. Besides large number of metrics, data can be further segmented by many attributes such as device type (PC, mobile phone, etc.), Operation System, Browser, geo locations/markets, and time (day in the week, date, week day or weekend). Some products can even classify their users based on their historical behavior into different categories in dimensions like interest, usage patterns, and engagement levels. The richness of data leads to opportunities to better understand nuances of the product, and the heterogeneity of the causal effect at individual level. On the other hand, it creates new issues such as privacy and ethics issues in data handling. In 2016 EU passed the landmark General Data Protection Regulation (Regulation 2016) (GDPR), effective from May 25th, 2018. Based on the legal premise that a natural person should have control over the data he or she generated, GDPR puts various requirements for a online business to inform consent of data collection, provide safeguards to protect personal data and to give people the right to access and erase their data. Online businesses have to consider and comply with these regulations when deciding how much data they need to collect.
Fluid Analysis. Besides a few prescribed analysis targets for OEC (overall evaluation criteria (Kohavi and Longbotham 2015)) or success metrics and key feature metrics, an experimenter will probably observe unexpected results in other metrics. Before seeing the results, it is unlikely that one knows all the questions he or she will be asking after looking at the results of an experiment. The targets of the analysis are almost always adaptive, with one discovery leads to another question. Fluid analysis often means breaking a taboo called “Data Snooping.” We only ask a question because the data suggested us so. One related statistical challenge is multiple testing. When we performing A/B tests on hundreds or thousands of metrics, the chance that we observe some “extreme” metric movements increases. This problem is even a bigger issue considering a typical A/B test provides multiple ways to further segment the data, and the fact that we might be testing many variants at the same time (e.g. A/B/n tests). Another type of fluid analyses is continuous monitoring and early stopping when an experimenter will decide when to stop an experiment based on the data collected up to a time point. Another common practice is to only focus on metrics that moves to the intended direction with enough “statistical significance.” This again is a type of fluid analysis with a strong self-selection. Data snooping exists in many other scientific areas, but in A/B test it is nearly impossible to avoid. In the following chapters where we dive deeper into the “science” part of A/B test, tackling issues arise in fluid analysis will be a recurring theme.
Instrumentation and Telemetry. Another aspect of A/B test that differentiates it with traditional application of randomized experiments is the complexity in Instrumentation and Telemetry. In computer science, instrumentation means having a piece of software to be able to monitor or measure the level of a product’s performance, to diagnose errors, and to write trace information. The whole process of logging and collecting these data is also called telemetry. This is a big topic by itself and deserves its own section.
7.2 Instrumentation and Telemetry
User Identification and Tracking. The first challenge is how to identify and track users. The most common approach is to use browser cookie. A browser cookie is a small piece of data stored by the user’s browser associated with a particular web domain. When a user send any request to a web domain, cookies associated will be sent to the server in HTTP header (request cookies). The receiving server can look at the cookies and use the information. For user tracking, the cookie needs to contain a globally unique identifier (GUID). When the request cookies does not contain a proper GUID, the server can generate a new one and send it back to the user’s browser (response cookie).
Cookies are always associated with a domain. (First party) Cookies are intended to store information a user willing to share with the site or web product one is interacting with. Each web site/product can only read from and write cookies to its own domain. This is why it is hard to do cross-site or cross-product user identification using cookie. This restriction is important for security and privacy! Users using one site or product only knows what they are interacting with and do not expect the information they provide to be accessible by others. One approach for cross-site user tracking is to use a 3rd party domain cookie. To do that, A.com uses a resource (such as a banner ads, or a transparent 1 by 1 pixel) from Z.com. When a user visit A.com, the browser will send a separate request to Z.com and Z.com can manage cookie under its domain. If another site B.com is owned by the same company, and B.com also does the same thing and allow Z.com to track its users, then the company is able to use Z.com as the central user tracking domain and track users across A.com and B.com. However, 3rd party cookie presents a security and privacy concern and most modern browsers contains privacy settings that can block 3rd party cookie.
There are several issues when using cookie to identify users. First, cookies are tied to a browser which are usually tied to a device. But we know modern users of web products typically have multiple devices. Worse, people use different browsers even in one devices. When using cookies for user identification, we have to keep in mind that the real number of users are smaller and could be smaller by a significant factor. Second, cookie can get lost or cleaned. Cookie storage is not in any standard so different browsers implement their own way. Sometimes a browser crash or update can cause cookies to be deleted. More often, users out of privacy concerns can choose to delete their cookies periodically, or in some cases use privacy mode or incognito mode in which cookies are automatically deleted when the page is closed.
The phenomenon of cookie lost is known as cookie churn in web industry. Using data from Atlas (Facebook’s online advertisement solution), Coey and Bailey (2016) reported in a period of 1 month (July 2015), it is observed that over half of the users have more than 1 cookies and over 10% of them are associated with more than 10. Their paper also shows the distribution of cookies per user in the one month period displays high skewness and long tail (probably due to privacy mode).
Cookie churn has several direct impact on A/B tests. First, cookie churn causes experience fragmentation. If an A/B test choose to randomize by user and user is tracked using cookie, for users with multiple cookies they will appear as separate users in the test. Each cookie of the same real user are independently randomized into different experiences, causing user’s experience to switch during the experiment. Experience fragmentation introduces bias in treatment effect estimation. A treatment experience is only exposed to a fraction of a user’s whole experience and potentially reduce or dilute the real effect the treatment could have been should it be exposed to a user for the whole time. This dilution effect means the treatment effect estimated using unadjusted difference of metric values from the treatment and control has a negative bias. Another source of negative bias is through leakage. Some treatment effect has a carry over effect — exposing a user to a treatment can affect the user’s behavior at a later time, even when the user receives the control experience. Because of the leakage effect, a treatment with positive effect can have a carry overed positive effect for the same user when they are under control (with a different cookie) at a later time, making control looks better too. Coey and Bailey (2016) studied the bias induced by leakage and showed some interesting results under a simplified model that individual treatment effect only depends on the rate of exposure and the same effect carry over to the whole user regardless of the treatment assignment of a cookie.
Another fundamental impact of cookie churn is that it is often hard and in some cases impossible to track users for months to understand certain long-term effect.
Exercise. An experiment ran for N weeks used browser cookies as user identifier. Assume everyone only have one browser, and everyone visit the product exactly 3 times a week. If 90% of users never clear their cookie and 10% clear their cookies after every visit, e.g. in a incognito mode. How will the cookie clearing affect the sample size, and the metric of visits per user?
The situation is much better for products requiring users to log in using their accounts. An account id can be a user name or a user’s email address that is used to register with a product. In this case, a straightforward approach is to anonymize this id into a GUID using a deterministic algorithm and store the anonymized id in a browser cookie. Every time this cookie gets lost, the server can always recover it by replaying the same anonymization procedure and return the cookie back. Moreover, if the same id is used to log the same user in a suite of related products, each with their own logs, this id can be also used to merge these logs together into a better view of users’ behavior, under appropriate privacy restriction. This is certainly a much more ideal situation than the simple cookie based user tracking. The drawback is also obvious, the requirement of user creating account and log in might add additional friction to attract new users. To lower this barrier, more web products start to allow users to log in using their existed account for other popular services such as facebook and google mail through OAuth. Account creation also brings other features such as user preference and settings sync. More and more new generation of web sites and mobile applications provide heavily personalized experience, making account creation a natural requirement. However, even for these products, when trying to increase new user sign up and optimize the account creation process, user tracking can still only use cookies.
Randomization. Randomization is often implemented using a deterministic hash function. The purpose of the hash function here is not for cryptographic purpose, but only to efficiently bucket an item into a prescribed number of buckets. A typical hash function first maps an object, usually a string representing an id of a unit (randomization unit), into a 16bit or 32bit array and then can be converted into an integer in a range, e.g. 0 to 999. An ideal hash function for A/B tests satisfies the following properties:
- Uniform. The hash to the integer range is uniformly distributed.
- Fast and efficient. Hash function can process single item or a batch of item fast enough so the randomization step will not hurt site performance.
- Avalanche effect. A small change in the input (for example, change one character in the string of id) will cause the output to change significantly. This means the hash value is hard to predict. Also, avalanche effect enables us to construct a new “independent” hash functions by append or prefix a seed to the hash input. In A/B tests running in parallel, it is important that the randomization for the two overlapping experiments are independent.
Since the usage of hash function does not need to be as secure as in other cryptographic usages, speed is more important. Fast hashing algorithms such as xxHash, SpookyHash, MurmurHash, CityHash are preferred to most common cryptographic hashing algorithms like MD5 or SHA.
Event Tracking. No meaningful measurement can be made without basic client-side instrumentation of event tracking. A client here means a user’s local application that can interact with a web server. Browsers, modern desktop applications with network features, mobile apps are all examples of a client. A client-side instrumentation is a piece of code that will be executed by a client that can log information and (immediately or at a later time in a batch) sent to the server.
Most modern web technologies are based on HTTP and JavaScript. For illustration, we use the following example of a web browsing. When a user browses a web site, a HTTP request is sent to the server of that website asking for the web page (HTTP request contains cookies in the header). The server returns a HTML — a format a browser can use to construct and render the web page. This HTML can reference static resources such as images and icons, and also reference JavaScript resources. A JavaScript is a set of procedures that can be executed in the browser when certain event triggers. For example, a piece of code in the JavaScript can say, when a link is clicked, send a new request containing information about the click including the link and the time (the payload) to the server. Since requests emitted by JavaScript and used for tracking are not really requesting information, they are usually implemented by requesting a very small resources such as 1 by 1 transparent pixel images to minimize the impact of user experience and network usage. This type of requests is sometimes called a beacon or a ping. The payload of the request will contain the event name, e.g. a click, a mouse hover event, a keyboard press event, etc. ,timestamp, and other useful information such as a session id that can allow analysis to link events together to reconstruct user’s behavior over time for a period of time.
Because event tracking happens at the client-side, there is also a possibility that it will fail and cause telemetry loss.
- JavaScript can fail to execute. JavaScript is a piece of code and relies on the browser’s JavaScript engine to execute. JavaScript itself can contains bugs that cause crash.
- Beacon request fail to be received by the server. This can happen when the browser did not make the request, or network issue prevented the browser to make a successful request.
- Client-side data loss. Sometimes we don’t want to send each individual tracked events back instantly. For mobile devices using cellular network without WiFi, it is important that the app will not waste user’s quota on nonessential telemetry signals. In this case, telemetry can be sent back in batch, and/or wait until the device is connected to a wired or WiFi network. For this period of telemetry storing in local devices, there is always a chance they can get lost due to software bug, crash, or even user instruction of cleaning up.
Telemetry loss might be impossible to avoid. A/B testing practitioners nevertheless need to understand its impact starting from a basic understanding of how bad the data lost is. In most cases even there is a minor degree of telemetry lost, as long as different testing variants (treatments and control) are impacted equally, we can treat the telemetry loss as one of the confounders that gets “randomized away.” There exist cases where the treatment can interfere with the event tracking causing differences in telemetry loss rate for different variants. Results of A/B tests in this case will be invalid and can easily lead to wildly misleading results.
Click Tracking. Click event is one of the most important events to track. It has its unique challenge and complexity. If a click does not navigate out of the current page-view, then its behavior is similar to other events. However, many clicks are on a hyper-link which tells the browser to navigate to another page. There are two ways of define a hyper-link in HTML. Default is to open new page in the current view. Another is to open new page in a new browser tab or window. In the default open in current view case, there is a race condition for the browser: the browser need to open a new page to replace the current one, the browser also know the current page wants it to send a beacon to the server with click tracking payload. Which one takes priority?
Turns out, there is no consensus nor standard rule to determine priority. Different browsers and different JavaScript engines might have different results. To avoid the fate of tracking such an important event by different browser implementation, engineers can insert a delay in click navigation, so the browser will try to send the beacon before start to load the new page. The larger the delay, the more likely the beacon will be successfully sent, and the more reliable click tracking will be. But large delay between users’ clicks and new page loading creates a lagged, hurting user experience. The optimal choice of delay is obviously case by case and deserves some tuning to balance between click tracking loss and user experience. Common choices vary between 50ms to 400ms. Kohavi et al. (2010) compared different choices and for a portal site like msn.com, they recommended 150ms delay for most browsers.
Because click tracking is sensitive to the speed of the browser running JavaScript script and sending beacons, sometimes some treatment tested in an A/B test, especially those that touches JavaScript resources, can unexpectedly affect click tracking. Kohavi et al. (2012) documented a real puzzling example.
Another much more reliable click tracking method is through HTTP redirect. When a user visiting A.com click a link to B.com, the link is programed to first go to A.com (or another domain dedicated to click tracking owned by the same tracking party) and A.com will redirect the browser to B.com. Because the click beacon in this case will be a normal HTTP request and the browser will not face a race condition of two choices, this design will theoretically have the best fidelity and lowest click loss rate. In fact, that user’s browser will not get the destination to redirect to before the server processed the click beacon. However, the round trip of sending a HTTP request just to get a redirect is usually much longer than 150ms. As a result this approach hurts user experience the most and should only be used when a very high fidelity of click tracking is required.
Measuring Speed. Speed, commonly refer to web performance or site performance, is really important! In Section 7.1 we showed that for some case even 10ms is worth spending a whole engineering year to improve. How do we measure it?
There are two types of measurements, server-side performance and client-site performance. Server-side performance is much easier. The server can have detailed log about the request arrival, and timestamps of server-side processes, and we can compute any time intervals and know how long it takes for server to finish those tasks. Client-side performance relies on client-side event tracking. The most common metrics for client-side performance is the notion of user perceived time to a functioning page — the time from a user’s browser starts sending HTTP request, to the time the browser receives the HTTP response and is able to render the page for user to start using the page. One of the event is called onLoad, which is triggered once the browser has fully loaded all content for a page (including script files, images, CSS files, etc.). This event can be used to measure the time to a complete experience. Other more fine-grained events can be used to measure time to different stages in the page loading process, such as Document-Object-Model (DOM) content fully loaded. In some cases, to improve perceived speed, the server will send in different chunks and the web page can start be functioning after only a few chunks are received. If the page can show a lot of contents, user can start interact with the page if the content above the fold — contents visible without scrolling down the page — are loaded. It is important to focus on performance that matters most to users’ perception.
Before W3C came up with a recommendation of “Navigation Timing Specification” in 2012 for all browsers to implement, site performance tracking has to be instrumented as other event tracking. But there is a catch, the server does not know the time when the browser start sending the HTTP request — it only knows when it receives the request, and it must takes some time for the request to reach the server. Fortunately, this is a non-issue. Because when a page loaded event is triggered, the browser need to send a beacon to the server. This beacon will also take some time to reach to the server. If we assume the time it takes for the initial HTTP request to transfer from client to the server is the same as the time it takes for the beacon to travel to the server, then the server-side time interval of the two requests (the initial HTTP and the beacon request) should be the same as the client-side time interval!
Modern browsers and mobile applications based on them all implemented various performance timing interfaces specified by W3C. Under the new specification browsers allow web site and web services to collect better telemetry for performance signals.
7.3 Common Pitfalls
A section to briefly talk about common pitfalls. Details will be covered in later sections.
1. Fail to do AA test
2. Misinterpreting statistical result
- Fail to do AA test
- Underestimate variance
- Differences not by the change, not really cp.
- Carry over effect
- misinterpreting statistical result
-misinterpreting p-value
-Fail to adjust for multiple testing
-Fail to adjust for continuous monitoring
- Fail to have enough sample size to detect no ship change for key metrics.
- Fail to consider uncertainty in estimation. False trend
- Trigger effect dilution error
- Fail to run balanced experiment when having cache impact.
- Fail to understand External validity
- leap of faith? percent delta
- bias due to appearance
- long term effect and novelty effect
https://www.forbes.com/sites/bernardmarr/2018/05/21/how-much-data-do-we-create-every-day-the-mind-blowing-stats-everyone-should-read/#10e78e2960ba↩︎
In fact, 1% change is often considered to be large.↩︎